This blog is brought to you by a special guest, Ana the Analyst.
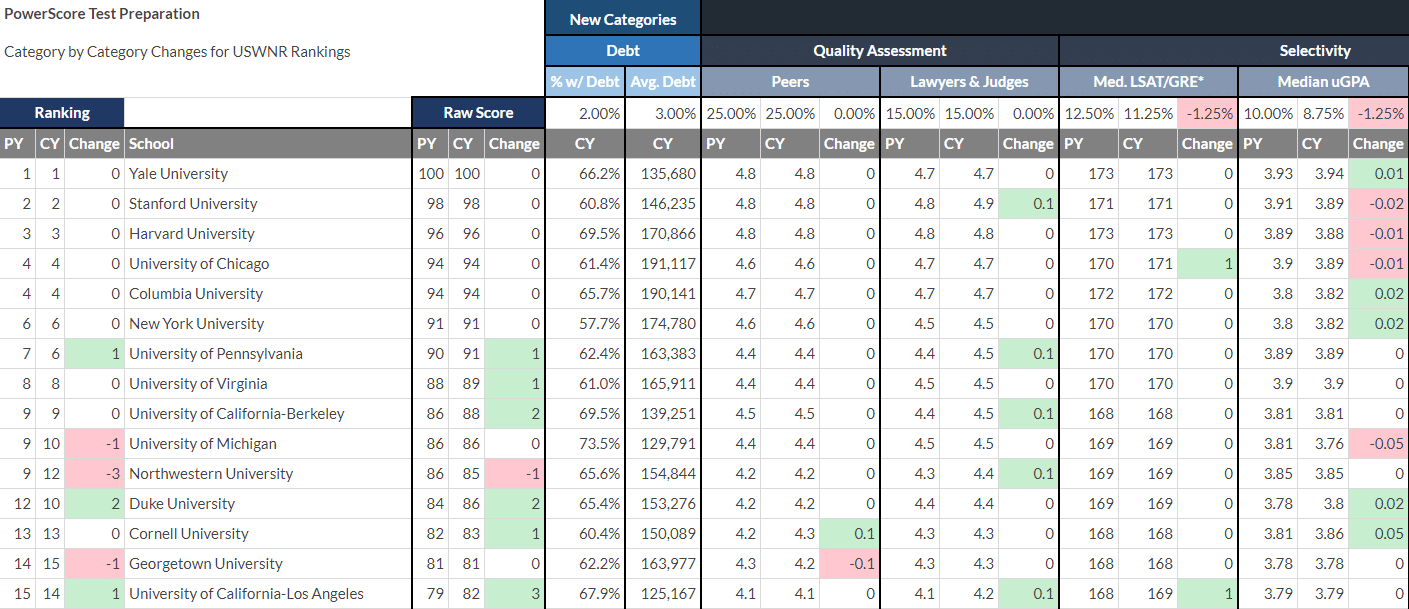
It is ranking season! One of the biggest questions that always comes up during this fretful period of US News change is, “Well, why did so-and-so rise? What terrible horrors befell Princeton Law that caused their drop of one whole place in the ranking?” This spreadsheet attempts to answer those questions for you with a category-by-category break-out of publicly available changes. Each category is listed by school, for the top 100 schools per the 2022 US News rankings.
Category by Category Differences in US News Rankings
We’re discussing all of the data from the chart above. To optimize your ability to view this chart, open it on a browser on a desktop or laptop.
There are a few things to note here. The first is that a decrease in the rankings doesn’t necessarily mean a decrease in the “quality” of the school for USN ews purposes. In fact, a number of schools increased in raw score while taking a dip in the ranking (i.e., University of Southern California, Arizona State, George Washington, Colorado). It is simply that peer schools had a little bit more movement than these schools did this year.
The second is that there was quite a furor regarding some changes to the rankings formula, with the introduction of average debt incurred for law school amongst students who took out debt (3% of the new formula) and percentage of students who took out debt (2%). The weights allocated to the “selectivity” categories of test scores, uGPA, and acceptance rate decreased correspondingly, as did the weights allocated to student/teacher ratio, amounts spent on services per student, and amount spent on financial aid. This is similar to the shifts made in the undergraduate rankings, to emphasize outcomes. It personally surprised me how low the % of students taking on debt was at certain schools; I expected more people to have to face a debt burden without the assistance of the rare full ride + stipend deals out there.
Changes to the Formula
There were two other interesting changes to the rankings formula: (i) an increase in weighted bar passage, which is first time bar passes divided by the weighted state bar passage for a particular school, and (ii) a more robust ranking system for the library. Previously, the library rankings included the number of titles and number of volumes available to students, which doesn’t do a whole lot of good for anyone. Now, the library has shifted to include more important factors, such as hours available, number of seats per student, and other factors.
In addition, a raw “increase” in a category (i.e., picking up an extra LSAT point in the median) can actually cause a “decrease” in score. This is because scores are based on standardized data. Data is standardized in relationship with the average, and the “points” allocated to a particular category are given based on how many standard deviations away from a category’s average a school happens to be. The more standard deviations, the more points. So if Princeton Law increases its LSAT score by one point, but everyone else increases their LSAT score by three points, Princeton Law’s LSAT “value” for rankings purposes actually goes down.
US News includes the median GRE scores as percentiles for the category “test scores.” For simplification purposes, and to allow as much of an apples-to-apples comparison as possible, only the LSAT scores are shown in the spreadsheet. US News also has a multi-tiered ranking system for the various categories of jobs, with full weight being applied to full-time, long-term, JD required and JD advantage jobs. For simplification purposes, only these numbers were shown. Most of this data can be found on schools’ ABA reports, which can be accessed here. Some of the data is only available on the US News website, and still other data is just not available to the public, and thus, not included in this spreadsheet.
The Big News
It looks like we have a new “T6”, as Penn caught up to NYU. Penn has long hung out in limbo between “T6” and the “lower half of the T14”; I wonder if the increasingly arbitrary cut-offs for ranking categories will change accordingly?
UCLA overtook GULC; UCLA’s raw score is also now within spitting distance of Cornell. Will we continue to see some shake up in the infamous “T14”, or will things stabilize after this year? Will schools at the tippy top become more generous financially with the new rankings, or do they not have an incentive to do so, with the distance that remains between them and everyone else?
Texas A&M, a relatively young program, has claimed a meteoric rise past Baylor and Texas Tech, two other stalwarts of the Lone Star State. Will the power of its undergrad university push it past SMU?
Only time will tell! But for now, these year’s rankings have been etched into history.


Leave a Reply