

This blog is brought to you by a special guest, Ana the Analyst.
As we gear up for the 2021-2022 law school admissions cycle, there has been a new wave of posts asking, “what are my admission chances?” A number of websites and methods exist to bring aspiring applications tiny margins of hope. However, like all things on the internet, these websites need to be taken with a grain of salt.
Two Student-Based Admission Chances Sites
There are two main websites that provide admission chances based in search form: MyLSN and LawSchoolData. These sites are based on self-reported data such as GPA, LSAT, URM status, month applied, etc.
MyLSN pulls data from LawSchoolNumbers, which is slightly outdated and not updated as often as LawSchoolData. LawSchoolData pulled in information from LawSchoolNumbers in the past, which means that applicants who used both websites may be showing up in the data more than once.
Self-Reported Data
Both sites used self-reported data, which has several issues. The first is that people on the internet lie. Shocking, I know! We don’t know whether or not we can trust the data provided.
The second is that the internet tends to draw in people who are disproportionately involved in the law school process: the high achievers. For instance, the acceptance rates reported on LSD and LSN school profiles for the Top 40 schools tend to be about 10% higher, on average, than the acceptance rates reported on school’s ABA reports.
The applicants on LSData also have disproportionately high LSATs compared to the overall applicant pool:
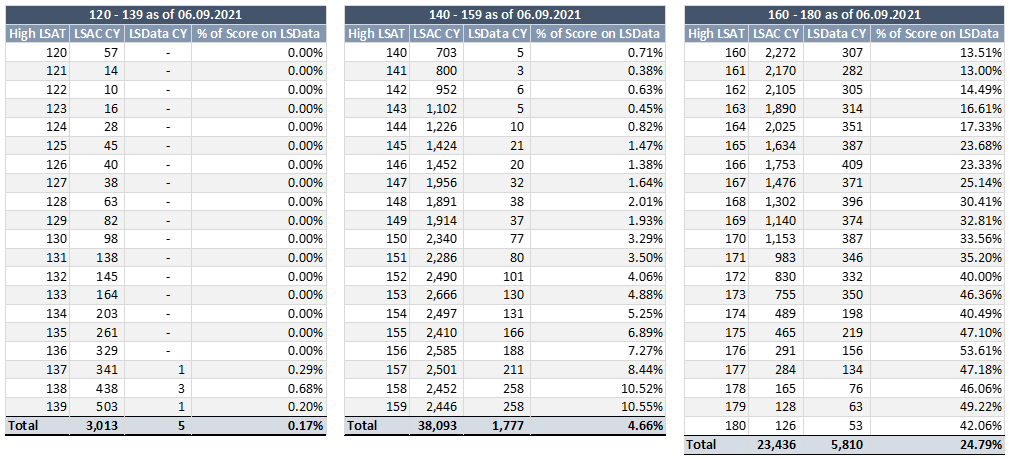
A third issue is that LSData and LSN users are not representative of the overall applicant pool. The number of applicants on LSData per a particular school have not broken 30% of the overall applicants a school actually receives. That means that at least 70% of a particular school’s applicants are not reflected on these online websites! Your “stats twin” could be in that 70%.
A fourth issue is that people don’t update their profiles. In a given year for a given school, up to 20% of applicants don’t post a final result. This can be especially bad for examining waitlist data and waitlist movement. Sometimes people get in and then just don’t get around to updating their profiles. Their successes, and failures, don’t end up showing up in the search results.
LSAC’s Predictor: Regression Modeling
LSAC has a “search” function that uses regression modeling based off of prior year applicant data to provide a very wide range of chances. While this has the benefit of utilizing all of the data LSAC has available on actual applicants, it comes with a number of flaws. The first is that not all schools opt into the search function. That includes T6 schools such as Harvard, Yale, Stanford, Chicago, and NYU.
The second is that regression modeling is inherently flawed, especially for outlier cases such as “splitters” (one stat over median and one stat under) and “URMs” (under-represented minorities). Regression analysis is used in statistics to see the relationship between a dependent variable (admissions) and one or more independent variables (GPA, LSAT). Linear regression is, well, linear: it attempts to show a straight line between the variables.
This doesn’t accurately reflect “splitter” friendly schools, who are willing to take anyone who is over at least one median (shown on LSData as the “right angle of death”):
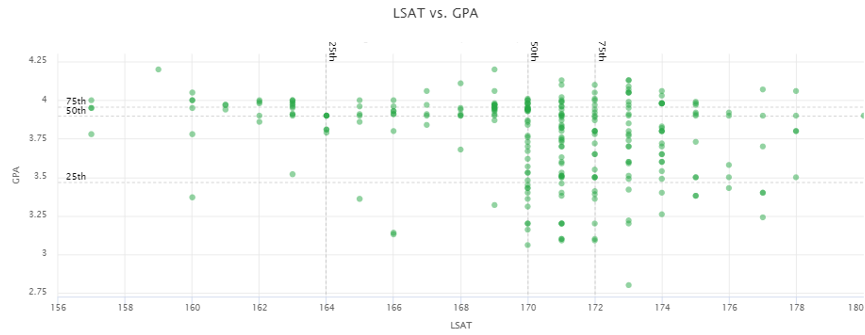
Those results are not exactly linear, and don’t make for great regressions.
Law Schools: Admissions Formulas
Some schools are kind enough to publish their admissions formulas for us on the LSAC website, known as the “Admissions Index.” These can be found on your transcript page under “Related Information” -> “Admissions Index.” Not every school publishes these formulas.
These formulas are based on similar concepts, where (A*LSAT) + (B*GPA) + Constant = some number. Most schools use the cumulative uGPA as calculated by LSAC; some use an “adj” number or the degree GPA. Schools generally use these formulas to sort applicants into “presumptive admit” and “presumptive deny” categories. Candidates are rejected from the presumptive admit pile every year. Candidates are accepted from the presumptive deny pile every year. We unfortunately are not given the applicable cut-offs or formula targets for each school along with the Index, which render these basically useless for predicting outcomes. It is a good way to see which schools care more about LSAT and which ones care more about GPA, however.
The Index for the 2019-2020 cycle was as follows:
| Code | Law School | A XLSAT | B XGPA | C + CONSTANT |
|---|---|---|---|---|
| 1829 | The University of Akron School of Law | 0.047 | 0.395 Cum | -5.912 |
| 1830 | The University of Alabama School of Law | 0.586 | 6.363 Cum | -33.075 |
| 2946 | Albany Law School | 0.048 | 0.349 Cum | -5.871 |
| 5007 | American University Washington College of Law | 0.03 | 0.345 Cum | -2.68 |
| 5829 | Appalachian School of Law | 1 | 10 Cum | 0 |
| 4832 | The University of Arizona James E. Rogers College of Law | 1.08 | 14 Cum | 0 |
| 6866 | University of Arkansas School of Law | 1 | 13.4 Cum | 0 |
| 6368 | University of Arkansas at Little Rock, William H. Bowen School of Law | 1.286 | 9.81 Cum | -173.906 |
| 5344 | Atlanta's John Marshall Law School | 0.033 | 0.248 Cum | -3.224 |
| 1801 | Ave Maria School of Law | 0.051 | 0.455 Cum | -6.041 |
| 5810 | University of Baltimore School of Law | 0.048 | 0.32 Cum | -5.314 |
| 5830 | Barry University Dwayne O. Andreas School of Law | 0.034 | 0.371 Cum | -3.354 |
| 6032 | Baylor University School of Law | 0.051 | 0.32 Cum | -6.339 |
| 3083 | Boston College Law School | 1.199 | 14.198 Cum | -172.231 |
| 4019 | Brigham Young University--J. Reuben Clark Law School | 0.024 | 0.231 Cum | -1.369 |
| 2047 | Brooklyn Law School | 0.028 | 0.389 Cum | -2.565 |
| 2925 | University at Buffalo School of Law, The State University of New York | 0.031 | 0.251 Cum | -2.258 |
| 4833 | University of California, Berkeley, School of Law | 0.871 | 23.487 Cum | 8.474 |
| 4834 | University of California, Davis School of Law (King Hall) | 0.037 | 0.335 Cum | -0.408 |
| 4342 | University of California Hastings College of the Law | 0.034 | 0.196 Cum | -2.801 |
| 4360 | University of California, Irvine School of Law | 0.026 | 0.234 Cum | -1.564 |
| 4837 | University of California at Los Angeles (UCLA) School of Law | 0.03 | 0.305 Cum | -2.68 |
| 4802 | California Western School of Law | 0.484 | 3.058 Cum | -2.09 |
| 5100 | Campbell University, Norman Adrian Wiggins School of Law | 0.424 | 3.879 Cum | 4.563 |
| 1099 | Capital University Law School | 1 | 10 Cum | 0 |
| 2990 | Benjamin N. Cardozo School of Law, Yeshiva University | 0.03 | 0.26 Cum | -2.389 |
| 1105 | Case Western Reserve University School of Law | 0.034 | 0.445 Cum | -3.635 |
| 5104 | The Catholic University of America, Columbus School of Law | 0.536 | 3.37 Cum | -12.036 |
| 4926 | Chapman University Dale E. Fowler School of Law | 0.03 | 0.299 Cum | -2.87 |
| 5821 | Charleston School of Law | 0.045 | 0.322 Cum | -4.643 |
| 1115 | Chicago-Kent College of Law, Illinois Institute of Technology | 0.033 | 0.449 Cum | -3.439 |
| 1833 | University of Cincinnati College of Law | 1.203 | 11.928 Cum | -68.272 |
| 1221 | Cleveland State University--Cleveland-Marshall College of Law | 0.052 | 0.535 Cum | -6.834 |
| 2163 | Columbia University School of Law | 0.045 | 0.559 Cum | -5.512 |
| 4881 | Concordia University School of Law | 0.053 | 0.348 Cum | -6.353 |
| 2098 | Cornell Law School | 0.024 | 0.205 Cum | -1.29 |
| 6121 | Creighton University School of Law | 0.05 | 0.338 Cum | -5.901 |
| 2585 | City University of New York School of Law | 0.046 | 0.323 Cum | -5.134 |
| 1834 | University of Dayton School of Law | 0.05 | 0.419 Cum | -5.974 |
| 4842 | University of Denver Sturm College of Law | 0.039 | 0.356 Cum | -4.161 |
| 1165 | DePaul University College of Law | 0.041 | 0.366 Cum | -4.343 |
| 1835 | University of Detroit Mercy School of Law | 0.048 | 0.303 Cum | -5.347 |
| 5245 | University of the District of Columbia--David A. Clarke School of Law | 0.016 | 0.236 Cum | -0.251 |
| 6168 | Drake University Law School | 1 | 10 Cum | 0 |
| 2907 | Drexel University Thomas R. Kline School of Law | 0.034 | 0.446 Cum | -3.818 |
| 5156 | Duke University School of Law | 0.018 | 0.224 Cum | -0.353 |
| 2196 | Duquesne University School of Law | 0.041 | 0.542 Cum | -5.294 |
| 1331 | Faulkner University, Thomas Goode Jones School of Law | 0.063 | 0.247 Cum | -7.4 |
| 5832 | Florida A&M University College of Law | 0.053 | 0.309 Cum | -6.138 |
| 5320 | Florida Coastal School of Law | 0.038 | 0.321 Cum | -3.787 |
| 5812 | University of Florida, Fredric G. Levin College of Law | 0.027 | 0.359 Cum | 0.144 |
| 5831 | Florida International University College of Law | 0.058 | 0.427 Cum | -7.712 |
| 5219 | The Florida State University College of Law | 0.505 | 5.021 Cum | -14.644 |
| 2259 | Fordham University School of Law | 0.028 | 0.237 Cum | -2.092 |
| 5827 | George Mason University, Antonin Scalia Law School | 0.036 | 0.196 Cum | -3.095 |
| 5813 | University of Georgia School of Law | 0.041 | 0.515 Cum | -5.316 |
| 5251 | Georgia State University College of Law | 0.038 | 0.4 Cum | -4.237 |
| 4329 | Golden Gate University School of Law | 0.046 | 0.293 Cum | -4.949 |
| 4330 | Gonzaga University School of Law | 0.035 | 0.428 Cum | -3.692 |
| 4867 | University of Hawai'i at Manoa | William S. Richardson School of Law | 0.037 | 0.286 Cum | -3.677 |
| 6870 | University of Houston Law Center | 0.033 | 0.297 Cum | -3.234 |
| 5297 | Howard University School of Law | 0.385 | 3.541 Cum | 12.328 |
| 4843 | University of Idaho College of Law | 0.042 | 0.277 Cum | -4.458 |
| 1836 | University of Illinois College of Law | 0.031 | 0.279 Cum | -2.764 |
| 1324 | Indiana University Maurer School of Law--Bloomington | 0.021 | 0.183 Cum | -0.797 |
| 1325 | Indiana University Robert H. McKinney School of Law | 0.035 | 0.357 Cum | -3.58 |
| 6681 | The University of Iowa College of Law | 0.811 | 11.298 Cum | 4.052 |
| 1344 | UIC John Marshall Law School | 0.039 | 0.398 Cum | -4.036 |
| 6871 | The University of Kansas School of Law | 1.129 | 7.844 Cum | -9.134 |
| 1837 | University of Kentucky College of Law | 0.039 | 0.43 Cum | -4.546 |
| 4381 | University of La Verne College of Law | 0.042 | 0.192 Cum | -4.158 |
| 4384 | Lewis & Clark Law School | 0.041 | 0.26 Cum | -4.356 |
| 5834 | Liberty University School of Law | 0.047 | 0.328 Cum | -5.405 |
| 4419 | LINCOLN LAW SCHOOL OF SACRAMENTO | 0.128 | 0.878 Cum | -16.082 |
| 6373 | Louisiana State University, Paul M. Hebert Law Center | 1 | 10 Cum | 0 |
| 1838 | University of Louisville Brandeis School of Law | 0.045 | 0.519 Cum | -5.618 |
| 4403 | Loyola Law School, Loyola Marymount University | 0.055 | 0.535 Cum | -7.493 |
| 1412 | Loyola University Chicago School of Law | 0.03 | 0.317 Cum | -2.538 |
| 6374 | Loyola University New Orleans College of Law | 0.033 | 0.411 Cum | -3.407 |
| 3691 | University of Maine School of Law | 0.035 | 0.364 Cum | -3.692 |
| 1448 | Marquette University Law School | 3.6 | 35.3 Cum | -26.1 |
| 5814 | University of Maryland Francis King Carey School of Law | 0.039 | 0.469 Cum | -4.54 |
| 5195 | University of Massachusetts School of Law--Dartmouth | 0.009 | 0.421 Cum | 0.423 |
| 1459 | The University of Memphis--Cecil C. Humphreys School of Law | 0.04 | 0.518 Cum | -5.023 |
| 5409 | Mercer University School of Law | 0.4 | 4.299 Cum | 8.435 |
| 5815 | University of Miami School of Law | 0.041 | 0.438 Cum | -4.93 |
| 1168 | Michigan State University College of Law | 0.047 | 0.501 Cum | -6.04 |
| 6874 | University of Minnesota Law School | 0.035 | 0.272 Cum | -3.372 |
| 1332 | Mississippi College School of Law | 0.041 | 0.411 Cum | -4.769 |
| 1840 | The University of Mississippi School of Law | 0.031 | 0.464 Cum | -3.274 |
| 6875 | University of Missouri School of Law | 0.396 | 3.476 Cum | 10.614 |
| 6872 | University of Missouri--Kansas City School of Law | 0.049 | 0.467 Cum | -6.125 |
| 6900 | Mitchell Hamline School of Law | 0.045 | 0.375 Cum | -5.073 |
| 4489 | University of Montana--Alexander Blewett III School of Law | 0.033 | 0.361 Cum | -3.305 |
| 1974 | NASHVILLE SCHOOL OF LAW | 0.8 | 10 Cum | 0 |
| 6877 | University of Nebraska College of Law | 0.101 | 0.843 Cum | -12.757 |
| 3288 | New England Law | Boston | 0.048 | 0.412 Cum | -5.628 |
| 3395 | University of New Hampshire Franklin Pierce School of Law | 0.044 | 0.398 Cum | -5.208 |
| 4845 | The University of New Mexico School of Law | 0.042 | 0.4 Cum | -4.908 |
| 2552 | New York Law School | 0.044 | 0.458 Cum | -5.135 |
| 5816 | University of North Carolina School of Law | 0.034 | 0.332 Cum | -3.279 |
| 5495 | North Carolina Central University School of Law | 1 | 20 Cum | 0 |
| 6878 | University of North Dakota School of Law | 1.124 | 13.975 Cum | -162.825 |
| 6659 | University of North Texas Dallas College of Law | 0.048 | 0.234 Cum | -4.86 |
| 1559 | Northern Illinois University College of Law | 0.035 | 0.294 Cum | -3.223 |
| 1709 | Northern Kentucky University--Salmon P. Chase College of Law | 0.036 | 0.382 Cum | -3.701 |
| 1565 | Northwestern Pritzker School of Law | 0.057 | 0.856 Cum | -1.335 |
| 1841 | Notre Dame Law School | 0.707 | 7.985 Cum | -61.759 |
| 5514 | Nova Southeastern University--Shepard Broad College of Law | 0.032 | 0.388 Cum | -3.286 |
| 1591 | Ohio Northern University--Claude W. Pettit College of Law | 0.046 | 0.438 Cum | -5.643 |
| 1592 | The Ohio State University Moritz College of Law | 0.426 | 5.935 Cum | -1.422 |
| 6879 | University of Oklahoma College of Law | 0.148 | 1.507 Cum | -20.541 |
| 6543 | Oklahoma City University School of Law | 0.932 | 6.046 Cum | -3.919 |
| 4846 | University of Oregon School of Law | 0.039 | 0.284 Cum | -4.246 |
| 2644 | Pace University--Elisabeth Haub School of Law | 0.052 | 0.459 Cum | -6.452 |
| 2199 | The Pennsylvania State University, Dickinson Law | 0.016 | 0.212 Cum | -0.017 |
| 2202 | The Pennsylvania State University, Penn State Law | 0.034 | 0.346 Cum | -3.398 |
| 4326 | Pepperdine University School of Law | 1.135 | 10.563 Cum | 0 |
| 2927 | University of Pittsburgh School of Law | 0.039 | 0.381 Cum | -4.25 |
| 979 | University of Puerto Rico School of Law | 0.02 | 0.564 Cum | -2.053 |
| 3973 | Quinnipiac University School of Law | 0.047 | 0.384 Cum | -5.541 |
| 5822 | Regent University School of Law | 0.042 | 0.371 Cum | -4.859 |
| 5808 | University of Richmond School of Law | 0.028 | 0.347 Cum | -2.197 |
| 3081 | Roger Williams University School of Law | 0.042 | 0.486 Cum | -4.935 |
| 2177 | Rutgers Law School | 0.029 | 0.302 Cum | -2.483 |
| 2799 | St. John's University School of Law | 0.046 | 0.451 Cum | -5.615 |
| 6629 | Saint Louis University School of Law | 0.037 | 0.359 Cum | -4.077 |
| 6637 | St. Mary's University School of Law | 0.038 | 0.277 Cum | -3.899 |
| 5132 | St. Thomas University School of Law | 0.049 | 0.346 Cum | -5.704 |
| 1302 | Samford University, Cumberland School of Law | 0.039 | 0.373 Cum | -4.187 |
| 4849 | University of San Diego School of Law | 0.051 | 0.325 Cum | -6.208 |
| 4850 | University of San Francisco School of Law | 0.041 | 0.329 Cum | -4.755 |
| 4851 | Santa Clara University School of Law | 0.045 | 0.269 Cum | -4.741 |
| 4067 | Seattle University School of Law | 0.858 | 7.952 Degree | 35.154 |
| 2811 | Seton Hall University School of Law | 0.044 | 0.423 Cum | -5.318 |
| 6660 | SMU Dedman School of Law | 0.036 | 0.379 Cum | -4.059 |
| 5818 | University of South Carolina School of Law | 0.603 | 5.506 Cum | -82.354 |
| 6881 | The University of South Dakota School of Law | 0.445 | 3.65 Cum | 2.814 |
| 6654 | South Texas College of Law Houston | 0.057 | 0.314 Cum | -6.611 |
| 4852 | University of Southern California, Gould School of Law | 0.025 | 0.261 Cum | -1.618 |
| 1726 | Southern Illinois University School of Law | 0.04 | 0.331 Cum | -4.023 |
| 6663 | Southern University Law Center | 0.036 | 0.319 Cum | -3.431 |
| 4703 | Southwestern Law School | 0.042 | 0.239 Cum | -4.252 |
| 6810 | University of St. Thomas School of Law--Minneapolis | 0.038 | 0.391 Cum | -4.138 |
| 4704 | Stanford University Law School | 0.018 | 0.402 Cum | -1.172 |
| 5630 | Stetson University College of Law | 0.032 | 0.391 Cum | -3.167 |
| 3771 | Suffolk University Law School | 0.037 | 0.359 Cum | -3.69 |
| 2823 | Syracuse University College of Law | 0.045 | 0.354 Cum | -5.108 |
| 4973 | Thomas Jefferson School of Law | 0.045 | 0.297 Cum | -4.807 |
| 2906 | Temple University--James E. Beasley School of Law | 0.046 | 0.45 Cum | -5.842 |
| 1843 | University of Tennessee College of Law | 0.689 | 7.582 Cum | 267.167 |
| 6801 | Texas A&M University School of Law | 0.031 | 0.41 Cum | -3.166 |
| 6824 | Texas Southern University--Thurgood Marshall School of Law | 0.047 | 0.328 Cum | -5.199 |
| 6827 | Texas Tech University School of Law | 0.036 | 0.361 Cum | -4.04 |
| 1845 | The University of Toledo College of Law | 0.045 | 0.4 Cum | -5.304 |
| 2902 | Touro College--Jacob D. Fuchsberg Law Center | 0.047 | 0.381 Cum | -5.049 |
| 6832 | Tulane University Law School | 0.036 | 0.375 Cum | -3.637 |
| 6883 | The University of Tulsa College of Law | 0.038 | 0.395 Cum | -4.093 |
| 4853 | University of Utah S.J. Quinney College of Law | 1.2 | 14.161 Cum | -62.332 |
| 1871 | Vanderbilt Law School | 0.03 | 0.336 Cum | -2.772 |
| 3946 | Vermont Law School | 0.03 | 0.292 Degree | -2.388 |
| 2959 | Villanova University Charles Widger School of Law | 0.045 | 0.459 Cum | -5.519 |
| 5885 | Wake Forest University School of Law | 0.435 | 2.87 Cum | 5.547 |
| 6928 | Washburn University School of Law | 0.051 | 0.353 Cum | -6.111 |
| 4854 | University of Washington School of Law | 0.404 | 6.757 Cum | -2.026 |
| 6929 | Washington University School of Law | 0.019 | 0.187 Cum | -0.21 |
| 5887 | Washington and Lee University School of Law | 0.018 | 0.225 Cum | -0.268 |
| 1898 | Wayne State University Law School | 0.037 | 0.382 Cum | -3.857 |
| 5904 | West Virginia University College of Law | 0.03 | 0.334 Cum | -2.74 |
| 1796 | Western Michigan University Thomas M. Cooley Law School | 0.04 | 0.25 Cum | -3.926 |
| 3962 | Western New England University School of Law | 0.03 | 0.266 Cum | -2.27 |
| 4969 | Western State College of Law at Westcliff University | 0.044 | 0.374 Cum | -5.42 |
| 2203 | Widener University Commonwealth Law School | 0.045 | 0.389 Cum | -5.253 |
| 4954 | Willamette University College of Law | 0.046 | 0.304 Cum | -5.087 |
| 5115 | William & Mary Law School | 0.027 | 0.342 Cum | -2.33 |
| 1846 | University of Wisconsin Law School | 0.036 | 0.46 Cum | -4.173 |
| 4855 | University of Wyoming College of Law | 0.869 | 12.38 Cum | -7.068 |
Law Schools: Applicant Profile Grid
The final, most accurate, and unfortunately rarest option to check how your individual stats fare is the Applicant Profile Grid that some schools publish in their Law School Descriptions on the LSAC website. The Applicant Profile Grid looks roughly as follows:
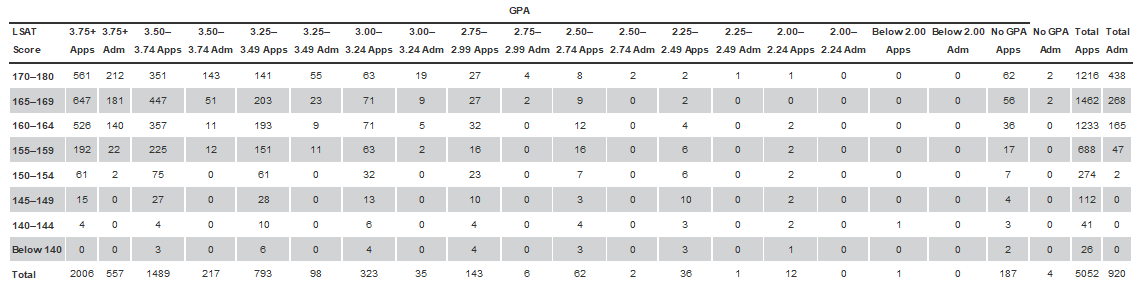
While the Applicant Profile Grids are ranged, it can still provide an understanding of who all applied to a given school and how their particular stats fared. It does not provide detail such as did an applicant apply Early Decision, were they URM, etc.
Most schools post some kind of caveat in the Applicant Profile section instead:
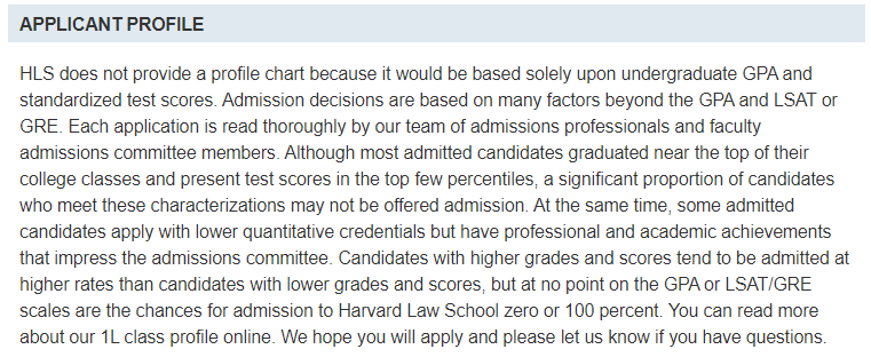
And while such caveats don’t give us the sweet, sweet comfort of having a 70% chance somewhere, they do make a valid point: an LSAT score or GPA can open a door for us; the rest of our application is necessary to get us through it. We can spend the time obsessing over what an arbitrary website says our chances might be, even with all of these websites’ flaws, or we can study for the LSAT. Or on our essays. We can make the most compelling application possible.
And that effort can’t be captured on any regression model.
Leave a Reply